Evaluation of In Situ Pavement Layers with the
Dynamic Cone Penetrometer (DCP)
Submission date: April 9, 2007
Word Count: 7,302
Authors:
Jeb S. Tingle
U.S. Army Engineer Research and Development Center 3909 Halls Ferry Road
CEERD-GM-A
Vicksburg, MS 39180
Phone: (601) 634-2467
Fax: (601) 634-4128
E-mail: Jeb.S.Tingle@erdc.usace.army.mil
Sarah R. Jersey
U.S. Army Engineer Research and Development Center 3909 Halls Ferry Road
CEERD-GM-A
Vicksburg, MS 39180
Phone: (601) 634-3373
Fax: (601) 634-4128
E-mail: Sarah.R.Jersey@erdc.usace.army.mil
Abstract
The dynamic cone penetrometer (DCP) is rapidly becoming the primary tool for assessing the in situ strength of unbound pavement layers. The U.S. Army Corps of Engineers (USACE) has adopted the DCP for use in the evaluation of existing unbound pavements and shallow foundations. This paper describes the USACE’s recommended procedures for using the DCP to evaluate in situ pavement materials. Regression models are presented to describe the relationship between the penetration rate or DCP index and the California Bearing Ratio (CBR), as well as a method for converting DCP results into bearing capacity values. Analysis techniques for interpreting DCP results are presented, and limitations of the device are noted.
The results of the analyses show that the correlations provide a simple means of obtaining estimates of key material properties. The relationships between penetration rate and CBR appear to be valid with some scatter associated with inherent variability of natural materials. The techniques and relationships described in this paper provide a relatively reliable means of estimating in situ material properties with the DCP.
Introduction
Variations of the dynamic cone penetrometer (DCP) have been used for almost a half- century to evaluate the in situ engineering properties of geomaterials including pavement base courses, subbases, and subgrade layers. The recent adoption of ASTM D 6951 demonstrates the growing popularity of the DCP for in situ strength determination. The principal use of the device has been to evaluate various strength parameters and layer thicknesses of shallow foundation soils and pavement layers. The utility of the device stems from its simplicity, repeatability, and ruggedness. Existing material strength tests such as the California Bearing Ratio (CBR), plate bearing test, and other bearing capacity tests require extensive field equipment to measure in situ properties. These tests are time consuming, ultimately restricting the number of replicates required to achieve minimum confidence levels. Many of these tests are sensitive to operator experience, requiring highly trained personnel to perform the tests properly. In pavement design, the CBR strength, modulus of subgrade reaction (plate bearing test), and resilient modulus are used to define the engineering properties of pavement materials. Unfortunately, the intricacy and logistics of performing a large number of in situ bearing capacity measurements or collecting undisturbed samples for laboratory resilient modulus testing restricts their frequent use.
Typically, laboratory test results or expedient field tests are used to estimate the desired engineering strength property. Thus, the use of the DCP and other devices to estimate desired engineering properties associated with more complicated tests is a compromise between accuracy and economy.
The primary objective of this paper is to describe the use of the DCP for estimating the CBR strength of in situ pavement layers, methods for estimating general bearing capacity, and techniques for identifying individual layer thicknesses. The device used by the U.S. Army Corps of Engineers (USACE) is described to distinguish it from alternative DCP devices of similar design. Models for converting penetration rates into CBR values are presented, and limitations of the device are noted. The equipment, models, and analysis procedures presented provide an effective means of evaluating the strength and thickness of in situ pavement layers, and should be equally applicable to the evaluation of other shallow foundations.
DESCRIPTION OF THE DUAL-MASS DYNAMIC CONE PENETROMETER (DCP)
The USACE standard dual-mass DCP consists of a 0.625-in.-diam. steel rod with a steel cone attached to one end, which is driven into the pavement or subgrade by means of sliding a dual mass hammer. Figures 1 and 2 show photos of the dual-mass dynamic cone penetrometer. The angle of the cone is 60 degrees, and the diameter at the base of the cone is 0.790 in. The diameter of the cone is 0.16 in. larger than that of the rod to minimize the potential for frictional resistance along the length of the rod. The dual-mass DCP is driven into the soil by dropping either a 17.6-lb hammer or a 10.1-lb hammer from a height of 22.6 in. The 22.6-in. top rod is threaded and welded to a handle. The bottom rod is threaded and welded to an anvil that transfers the force from the falling mass through the bottom rod to the cone tip. Although the length of the bottom rod varies commercially, the USACE uses a standard length of 39.4 in. The top rod with attached handle slides through the center opening in the hammer and is threaded into the top of the anvil. A hexagonal set screw is used to further tighten the top and bottom components of the DCP. The 17.6-lb hammer is converted to the 10.1-lb hammer by removing the hexagonal set screw and removing the outer steel sleeve. This design permits the change in dynamic force during a test since the outer sleeve slides over the device's handle. The cone penetration resulting from the 17.6-lb hammer is approximately twice that caused by the 10.1-lb hammer. The 10.1-lb hammer is more suitable for use in weaker soils with expected CBR strengths of 10 CBR or less. However, the 10.1-lb hammer can be used effectively in materials with CBR strengths up to 80 CBR, but significantly more effort is required to obtain the desired penetration in stronger materials. Thus, the 17.6-lb hammer is recommended when evaluating pavement materials with expected strengths in excess of 10 CBR. Two different types of cone tips are used. A hardened cone tip is used for very soft soils in which extraction is not expected to be difficult. The hardened cone tip is threaded into the bottom of the bottom rod.
Alternatively, a disposable cone tip was developed for use in soils where the standard hardened tip is difficult to remove. The disposable cone tip is mounted on an adapter that is threaded into the bottom of the bottom rod. The disposable cone is secured onto the adapter using a lubricated o-ring. At the conclusion of the test, the disposable cone disconnects from the adapter while the device is withdrawn, easing the extraction of the device. Finally, a graduated scale is provided to measure the penetration depth as the cone is driven into the material.
Test Procedure
Different agencies follow different test procedures. The U.S. Army Engineer Research and Development Center (ERDC) recommends the test procedure described herein. The USACE standard DCP typically requires two people to efficiently operate the device, an operator and a recorder. The operator holds the device by its handle in a vertical position over the test location and taps the hammer until the base of the cone is flush with the surface of the material being tested. The second person records an initial penetration reading at the bottom of the hammer (typically zero) prior to the start of the test. The hammer is then raised to the bottom of the handle and dropped. The operator should use caution not to strike the handle driving the device upward, which could dislodge the disposable cone tip and alter the dynamic force applied to the standard hardened cone tip. The hammer must be allowed to fall freely, striking the anvil without interference. The operator should also be careful not to exert any downward force on the handle during the test. The recorder is responsible for measuring and recording the penetration resulting from a given number of hammer blows during the test.
The depth of penetration is measured at selected drop intervals depending upon the hammer used and strength of the material being tested. A consistent interval such as 1, 3, 5, 7, or 10 blows per reading is used until a noticeable change in material strength is observed. This change might consist of a reduction in penetration due to encountering a firmer subsurface material layer or an increase in penetration caused by a softer subsurface layer. A minimum penetration of 25 mm between recorded measurements is recommended. Data taken at smaller penetration increments is excessive and may lead to inaccurate strength determinations, particularly in granular material. Consistent penetration measurements at a given blow interval in excess of 30 mm should dictate a reduction in number of blows between penetration measurements. Thus, the operator and recorder monitor the penetration at a set number of blows, adjusting the number of blows between recordings to maintain penetration within the range of 20 to 35 mm. Frequent adjustments in the number of blows between measurements due to minor changes in penetration is discouraged since it will complicate data recording and input. Penetration is often recorded to the nearest 5 mm, but greater accuracy is achieved when recorded to the nearest 1 mm. The operator should halt testing in the case of any noticeable increase in the penetration rate to allow the recorder to measure the penetration and adjust the blow count. The test is performed to a maximum depth of 39 in. The device is then extracted from the material by driving the hammer in an upward motion against the handle attached to the top rod. The hammer should be raised vertically rather than in an arcing motion to avoid applying torque to the top rod, which could result in damage to the device. If the operator experiences difficulty in extracting the device, disposable cones should be used. In some granular soils, the DCP may penetrate the soil at a slant rather than vertically. The operator should not apply force to straighten the rod as it may damage the device. If the DCP slants more than 6 in. from vertical, the test should be stopped and attempted at an alternate location. Upon completion of the test, the bottom rod should be cleaned with a wet cloth to prevent the accumulation of particles that would increase the frictional properties of the device.
CORRELATION OF PENETRATION RATE TO STRENGTH
CBR
The most common use of DCP results is the correlation of penetration index to CBR. Many relationships have been derived between penetration rate and CBR from a variety of laboratory and field experiments (1-4). Table 1 summarizes selected relationships from the literature. The relationship shown below in equation 1 was developed for the DCP penetration rate in mm per blow using the USACE standard DCP with the 17.6-lb hammer based upon numerous field tests including side-by-side in situ CBR and DCP measurements, where PR is the DCP penetration rate in mm per blow (5).
CBR = 292/PR1.12
Additional testing by the USACE resulted in the addition of equations 2 and 3 for soft CL and CH soils respectively. Thus, the relationships shown in equations 2 and 3 should be used for improved accuracy for soft CL and CH soils, respectively. Equation 1 should be used for all other soil types or when the soil type is unknown.
For CL Soils < 10 CBR CBR = 3452/PR2 R2 = 0.94 (2)
For All CH Soils CBR = 348/PR R2 = 0.98 (3)
Figure 3 shows a data plot of the correlations including the data points used to develop these relationships. These results were originally reported by Webster et al. (6). Additional data is being collected to confirm these results.
Bearing Capacity
Although CBR is frequently used in pavement evaluation and design, the analysis of shallow foundations requires an estimate of bearing capacity. Since direct comparative measurements of static bearing capacity and DCP penetration rate were not conducted, the relationship shown in equation 4 between bearing capacity and CBR was adapted from the Portland Cement Association (PCA) (7).
Bearing Capacity (psi), q = 3.794*CBR0.664 (4)
While this equation is not a direct correlation from DCP results, it does provide a means of reasonably estimating bearing capacity using DCP results converted to CBR.
Dynamic Modulus
Dynamic modulus or resilient modulus is a strength parameter of growing interest stemming from the transformation from empirical pavement design and evaluation procedures to mechanistic methodologies. Once again, direct comparative measurements between DCP penetration rate and dynamic modulus were not conducted, but equations 5 and 6 provide a means of estimating dynamic modulus from the DCP-correlated CBR values. Equation 5 was proposed by Huekelom and Klomp (8), while equation 6 was offered by Powell et al. (9).
E(psi) = 1500*CBR or E(MPa) = 10.34*CBR
E(psi) = 2550*CBR0.64 or E(MPa) = 17.58*CBR0.64
Modulus of Subgrade Reaction
The modulus of subgrade reaction is used in the design and evaluation of rigid pavements. Direct comparative tests were not performed, however equations 7 and 8 provide a reasonable means of estimating the modulus of subgrade reaction using CBR values obtained from DCP correlations. These equations are based on the charts provided in the Department of Defense's Unified Facilities Criteria Manual 3-260-03 (10).
For Soils CBR < 20 , k(PCI) = -242.93 – 5.49*CBR + 129.85*CBR0.5 (7)
For Soils 20 < CBR < 100, k(PCI) = -11.25 + 2.19*CBR + 60.23*CBR0.5 (8)
APPLICATIONS
The DCP is used for a variety of applications in pavement design, evaluation, and construction. The DCP can also be used for site investigations for shallow foundations. The device is typically used to estimate three important engineering properties of geomaterials: material strength, layer thickness, and degree of compaction. Each of these applications is discussed in the following text
Strength Determination
Material strength is an important parameter in the design and evaluation of pavements. As noted previously, various strength parameters can be effectively estimated through the thoughtful manipulation of the empirical relationships shown in equations 1 through 8. The principal relationship used is that between penetration rate and CBR as shown in equations 1 through 3.
Once the DCP test has been completed, the blows and corresponding penetration measurements can be used to compute the CBR using equations 1 through 3. For ease of analysis, equations 1 through 4 have been coded into an EXCEL spreadsheet using the Visual Basic programming software included in EXCEL. Thus, the EXCEL spreadsheet is capable of computing both the CBR and bearing capacity using DCP results. The user simply inputs the number of blows and corresponding penetration (in mm), selects the appropriate soil type which determines which PR-CBR relationship is used, and the hammer size used. As the data is entered, the plots of CBR versus depth and bearing capacity versus depth are updated. Figure 4 shows a typical view of the spreadsheet. Figure 5 shows a detailed view of the resulting CBR versus depth plot, while Figure 6 shows the corresponding bearing capacity versus depth plot.
Interpreting the data requires some engineering judgment. The homogeneity of the material impacts the smoothness of the data curve. With penetration measurements made at intervals of approximately 25 mm, the computed CBR for that discrete interval is often slightly different than either the previous or following intervals. This is particularly true of granular materials in which individual aggregates can impact a discrete interval measurement.
Unfortunately, some operators attempt to achieve greater accuracy by collecting data at smaller intervals; for example, every blow despite a penetration of less than 20 mm. This results in greater variability between discrete intervals and may permit inaccurate CBR estimates due to insufficient cone movement across an acceptable shear surface. Others attempt to expedite the testing process by simply recording the number of blows required to drive the rod the full 39 in. into the material. This results in a uniform plot of CBR with depth, but omits the evaluation of discrete layers within the system.
The recommended procedure for determining layer strengths is to select a representative value for each layer between individual oscillations of higher and lower CBR strengths. The selected strength should be such that one-half to two-thirds of the CBR values at discrete intervals within the layer are greater than the selected strength. Each layer should be evaluated independently. Transition zones at the top of the surface layer and between soil layers should not be used to define the individual average layer strength. For surface layers, the gradual increase in strength typically exhibited over the first few inches of material should be ignored. This effect is due to the lack of confinement at the surface, and the approximate depth required to achieve adequate confinement varies with material type as discussed in the section on device limitations. In CH materials, the adhesion of the cohesive clay material to the DCP rod adversely affects the penetration of the device at depths greater than 12 inches. Thus, the CBR appears to gradually increase with depth in CH materials beyond 12 inches. This is often referred to as a "stair stepping" effect and should be ignored when analyzing the strength of the CH soil layer. Figure 7 shows analysis results for a DCP profile with distinct layers, and Figure 8 shows analysis results for a DCP profile with less distinct layers. The resulting strengths for individual layers are then used to depict a representative profile for the material at an individual location. In addition to the EXCEL spreadsheet discussed in this paper, the ERDC has developed a DCP analysis tool embedded in its Pavement Computer Aided Structural Analysis (PCASE) software package available for download at http://www.pcase.com. In the evaluation of pavements, the individual layer strengths are used to identify the weakest or controlling location. In design, a representative subgrade strength must be determined. Typically, the 75th or 85th percentile CBR value for the desired material depth is used as the design value depending upon the desired reliability of the design.
Thickness Determination
The determination of significantly different material layers within a DCP profile plot is accomplished by visually identifying the trends in the plot. The layers are delineated by sudden increases or decreases in CBR strength. For pavement applications, a maximum of 4 individual material layers over the 39-in. depth is recommended. While additional layers can be delineated, they tend to unjustifiably complicate the analysis process. Webster et al. (6) developed general guidance for determining layers as a function of changing CBR strengths. They recommend that a layer be delineated when there is a decrease, or an increase, in CBR strength in excess of 25 percent over a 4-in. interval. Webster et al. (6) reported the ability to define layer thickness to within an accuracy of 1 in. for layers of significantly different material strength i.e. base course over a natural subgrade. Figures 7 and 8 shows the delineation of layers in typical CBR profile plots. The ERDC has developed an auto-layering routine incorporated in PCASE's DCP analysis tool for experienced users, which is available for download at http://www.pcase.com.
Compaction Control
MnDOT (11) and Gabr et al. (12) have used the DCP as a quality control device during construction to determine whether individual materials have been adequately compacted. While MnDOT was unable to correlate DCP penetration index to in situ density, a procedure was developed in which a minimum penetration rate from DCP measurements was established for acceptance of compaction of individual materials. This procedure is based upon a material- specific relationship between in situ density and a desired level of compaction, such as 95 percent of modified proctor. Once the material-specific relationship has been established, it is specified that the penetration rate must not exceed a desired level. Table 2 shows the guidance developed for MnDOT pavement materials. Using a similar calibration procedure between DCP penetration rate and standard in situ density testing, similar guidance could be developed for any local agency's materials. It is critical to note that this specification is for recently compacted materials that have not had the opportunity to "cure" or "set up" over time, which would result in significantly reduced penetration rates.
Gabr et al. (12) developed an alternate method of compaction control using a DCP device. The penetration rate of the DCP is correlated to liquidity index (LI) and degree of saturation (Sr) as proposed in equations 7 and 8, respectively.
LI = A*logPR – B (7)
Sr = 1 – e(C*PR) (8)
In equation 7, A and B are correlation constants, and PR is the DCP penetration rate in mm per blow. In equation 8, C is a correlation constant, and PR is the DCP penetration rate in mm per blow.
Once the LI and Sr have been estimated, then they can be used to compute in situ moisture content (equation 9) and dry density (equation 10) using the Atterberg limits and specific gravity of the material.
win situ = PL + [(A*logPR – B)*PI] (9)
d = / (10)
In equation 9, win situ is the in situ water content, PL is the plastic limit, and PI is the plasticity index. In equation 10, d is the in situ dry density, w is the unit weight of water, and Gs is the specific gravity of the material. Based on testing of three different fine-grained residual soils in the laboratory, Gabr et al. recommend a value of 0.65 for A, a value of 1.2 for B after correcting for laboratory specimen mold effects, and a value of –0.065 for C after correction for mold effects. These models produced coefficients of correlation (R2) between PR and LI and between PR and Sr of 0.86 and 0.82, respectively, for the soils tested.
The method proposed by Gabr et al. would be implemented by conducting laboratory tests to measure the Atterberg limits and specific gravity of a specific material that is to be used for construction. Then, the proctor samples from laboratory tests can be used to correlate PR to LI and Sr for the material. These curves would be used to calibrate the model for a specific material. The PR results from field tests following compaction would then be compared to the soil specific requirements set forth in project specifications. Both the method set forth by MnDOT and the method set forth by Gabr et al. were developed to simplify the quality control process by eliminating the need for time consuming in situ density and moisture content tests, such as sand-cone or traditional nuclear density/moisture measurements. While these models are soil specific, requiring calibration for individual construction materials, they demonstrate the application of the DCP in compaction control. The USACE only supports the use of the DCP for compaction control in contingency environments in which the situation or nature of the facility does not support the use of proper compaction control procedures. For commercial use, these procedures may be applicable to low-volume roads and other non-critical projects.
DEVICE LIMITATIONS
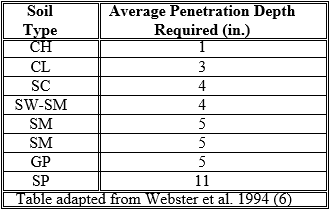
The DCP device does have several limitations that must be recognized when conducting tests and analyzing results. First, the device cannot penetrate permanent surfaced pavements without extreme physical effort and potential damage to the DCP device. Thus, for asphalt concrete and portland cement concrete pavements, a 1-in. hole is typically drilled through the surfacial materials to the top of the base or subgrade material before testing can be initiated. Secondly, as noted previously, due to a lack of confinement there is a transition at the surface of unbound or unsurfaced pavement layers where the strength measurements gradually increase to the representative value for the surface layer. The depth of penetration from the surface required to achieve adequate confinement is a function of material type, moisture content, and density.
Guidance proposed by Webster et al. (6) for estimating the depth required to achieve adequate confinement is summarized in Table 3. This transition is also shown in Figure 8 and should not be used to graphically determine the layer strength of the surface layer. Third, as in most shear strength tests, DCP results tend to exhibit greater variability in granular media. Also noted previously, is the characteristic increase in strength at depths beyond 12 inches of penetration in CH soils due to adhesion of the soil to the rod. This gradual, or stair step, increase in strength for CH soils beyond 12 inches of penetration should not be used in determining the strength of the CH soil layer. This "stair-stepping" in clay soils due to adhesion is shown for a CH material in Figure 7. A decrease in accuracy has been noted for materials less than 1 CBR due to the overall weight of the DCP device and the poor soil strength. Finally, the DCP measures penetration resistance, and very little historical data between penetration resistance and pavement performance exists. Thus, direct relationships between DCP results and pavement performance are rare and generally have not been verified. Therefore, the application of DCP results depends upon relationships developed from limited data sets and containing inherent variability. The user must recognize that the DCP is, in fact not a measure of CBR, and that actual CBR testing may provide different results depending upon the material. This is also true for the other strength parameters correlated to DCP penetration rate. The user must determine whether the inherent variability associated with DCP testing is acceptable for an individual project relative to the additional costs and reduced variability associated with traditional in situ and laboratory strength tests.
CONCLUSIONS AND RECOMMENDATION
Conclusions
The USACE dual-mass DCP device and testing procedure recommended by the U.S. Army Engineer Research and Development Center were synthesized. The DCP device used by the USACE, including device dimensions and weight, was described in detail. Test procedures and guidelines were presented, including recommendations for recording intervals with depth of penetration based on USACE experiences in order to obtain accurate and reliable results. The following conclusions were derived concerning the use of the DCP for in situ testing of unbound material strength:
- Various relationships between penetration rate and CBR, including the relationship used by the USACE, were presented. Additionally, existing relationships between CBR and strength parameters such as bearing capacity, resilient modulus, and modulus of subgrade reaction were presented. These relationships may be used to estimate strength parameters using CBR values obtained in the field using the DCP device in lieu of performing limited in situ testing with traditional
- The DCP may be used in a variety of pavement design, evaluation, and construction applications. Common applications include strength determination, thickness evaluation, and compaction control. The relationship between penetration ratio and CBR was coded into an EXCEL spreadsheet using the Visual Basic programming software, allowing rapid calculation of the CBR profile over the depth of the pavement
- The EXCEL spreadsheet can also be used to estimate layer thickness and bearing capacity in an expedient manner. Equations relating CBR to bearing capacity have been included in the EXCEL spreadsheet, providing a relatively rapid yet reliable estimation of the variation of bearing capacity with depth. Using the CBR and bearing capacity profiles, in situ layer thicknesses can be interpreted while minimizing disturbance to the pavement or
- An alternative analysis tool with automated routines for analyzing DCP results is available within the PCASE software package at http://www.pcase.com. Users should recognize that some interpretation of the results is still
- In certain situations, correlations between DCP-based CBR values and soil strength parameters or QC/QA methods such as those presented in the literature (11, 12) may be used to assess the strength or compaction characteristics of soils. These methods may be applicable in non-critical design and construction situations or in contingency operations where extensive in situ testing is neither economical nor
- Certain limitations are associated with the DCP. Many of these limitations are related to the soil type or location within the pavement structure. In particular, some limitations pertain to the applicability of results at the top of unbound layers and below a depth of 12 in. in CH materials. It is important to note these limitations both during the specification and interpretation of DCP
Recommendation
The use of the DCP for the evaluation of the in situ CBR of pavement materials should continue to be acceptable. When available, traditional compaction control devices should be used to verify that constructed pavements meet compaction requirements, however, assessment using the DCP should be performed to verify that materials meet or exceed strength criteria set forth by the design engineer. In certain situations, the DCP can be used to assess strength and compaction. Existing correlations between CBR and material properties such as bearing capacity, dynamic modulus, and modulus of subgrade reaction can be used with DCP based CBR values to provide an economic and reliable assessment of these properties, particularly in non- critical pavements where budget constraints prohibit extensive in situ testing. In the future, field tests should be conducted to validate and refine the correlations that utilize DCP penetration index to provide better methods of estimating additional material properties in an economical manner.
ACKNOWLEDGEMENTS
The tests described and the resulting data presented herein, unless otherwise noted, were obtained from research conducted under the AT40 program of the U.S. Army Corps of Engineers by the U.S. Army Engineering Research and Development Center, Waterways Experiment Station. Permission was granted by the Chief of Engineers to publish this information.
REFERENCES
- Harrison, J.A. Correlation Between California Bearing Ratio and Dynamic Cone Penetrometer Strength Measurements of Soils. In Proceedings of Institution of Civil Engineers, Part 2, 1987, pp. 833-844.
- Kleyn, E.G. The Use of the Dynamic Cone Penetrometer. Transvaal Roads Department, South Africa, 1975.
- Livneh, M. and Ishai, I. Pavement Material Evaluation by a Dynamic Cone Penetrometer. In Proceedings of Sixth International Conference, Structural Design of Asphalt Pavements, Vol. 1, 1987, pp. 665-676.
- Van Vuuren, D.J. Rapid Determination of CBR with the Portable Dynamic Cone In The Rhodesian Engineer, Vol. 7, No. 5, 1969, pp. 852-854.
- Webster, S.L., R.H. Grau, and T.P. Williams. Description and Application of Dual Mass Dynamic Cone Penetrometer. Instruction Report GL-92-3, US Army Engineer Waterways Experiment Station, Vicksburg, MS,
- Webster, S.L., R.W. Brown and J.R. Porter. Force Projection Site Evaluation Using the Electronic Cone Penetrometer (ECP) and the Dynamic Cone Penetrometer (DCP). Technical Report GL-94-17, U.S. Army Engineer Waterways Experiment Station, Vicksburg, MS,
- PCA, Design of Concrete Airport Pavement, Portland Cement Association,
- Huekelom, W., and A.J.G. Klomp, "Dynamic Testing as a Means of Controlling Pavements During and After Construction," Proceedings, (1st) International Conference on the Structural Design of Asphalt Pavements, 1962, pp. 667-685.
- Powell, W.D., J.F. Potter, H.C. Mayhew, and M.E. Nunn. The Structural Design of Bituminous Roads. TRRL Laboratory Report LR 1132. Transport and Road Research Laboratory, Crowthorne, United Kingdom, 1984
- Unified Facilities Criteria (UFC) 3-260-03 Airfield Pavement Evaluation, 2001
- Burnham, T.R., Application of the Dynamic Cone Penetrometer to Minnesota Department of Transportation Pavement Assessment Procedures. MN/RC-97/19, Minnesota Department of Transportation, St. Paul, MN, 1997
- Gabr, M.A., J. Coonse, and P.C. Lambe. "A Potential Model for Compactive Evaluation of Piedmont Soils Using Dynamic Cone Penetrometer (DCP)". Geotechnical Testing Journal., Vol 24 (3), September, 2001., pp. 308-313.
- Gabr, M.A., K. Hopkins, J. Coonse, and T. Hearne. "DCP Criteria for Performance Evaluation of Pavement Layers". Journal of Performance of Constructed Facilities, Vol 14 (4), November 2000, pp. 141-148.
LIST OF TABLES AND FIGURES
FIGURE 1 Picture of the U.S. Army Corps of Engineers (USACE) Dual Mass DCP
FIGURE 2 Picture of the DCP in Use on an Unsurfaced Taxiway
FIGURE 3 USACE Correlations between Penetration Rate and CBR
FIGURE 4 EXCEL Spreadsheet used to Compute CBR using DCP Results
FIGURE 5 Typical CBR Profile Computed using EXCEL Spreadsheet
FIGURE 6 Typical Bearing Capacity Profile Computed using EXCEL Spreadsheet
FIGURE 7 Analysis Results for a DCP Plot with Distinct Layers
FIGURE 8 Analysis Results for a DCP Plot with Marginal Layer Differences
TABLE 1 Relationships Between DCP Penetration Index (PR) and CBR
TABLE 2 MnDOT Limiting Penetration Rates for Compaction Control
TABLE 3 Estimation of Depth Required to Achieve Adequate confinement in Unbound Surfacial Layers
Figure 1
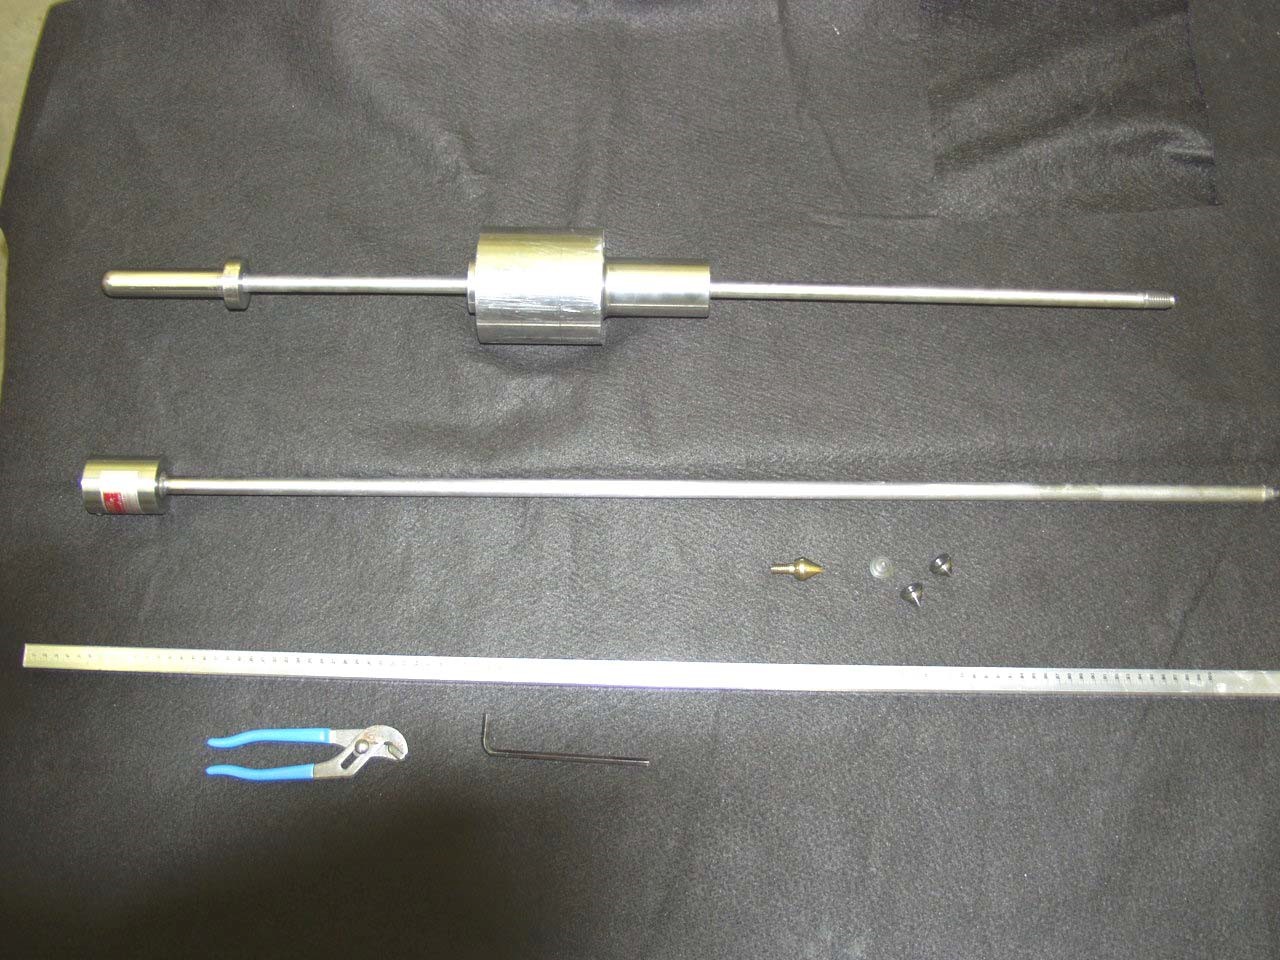
Figure 2
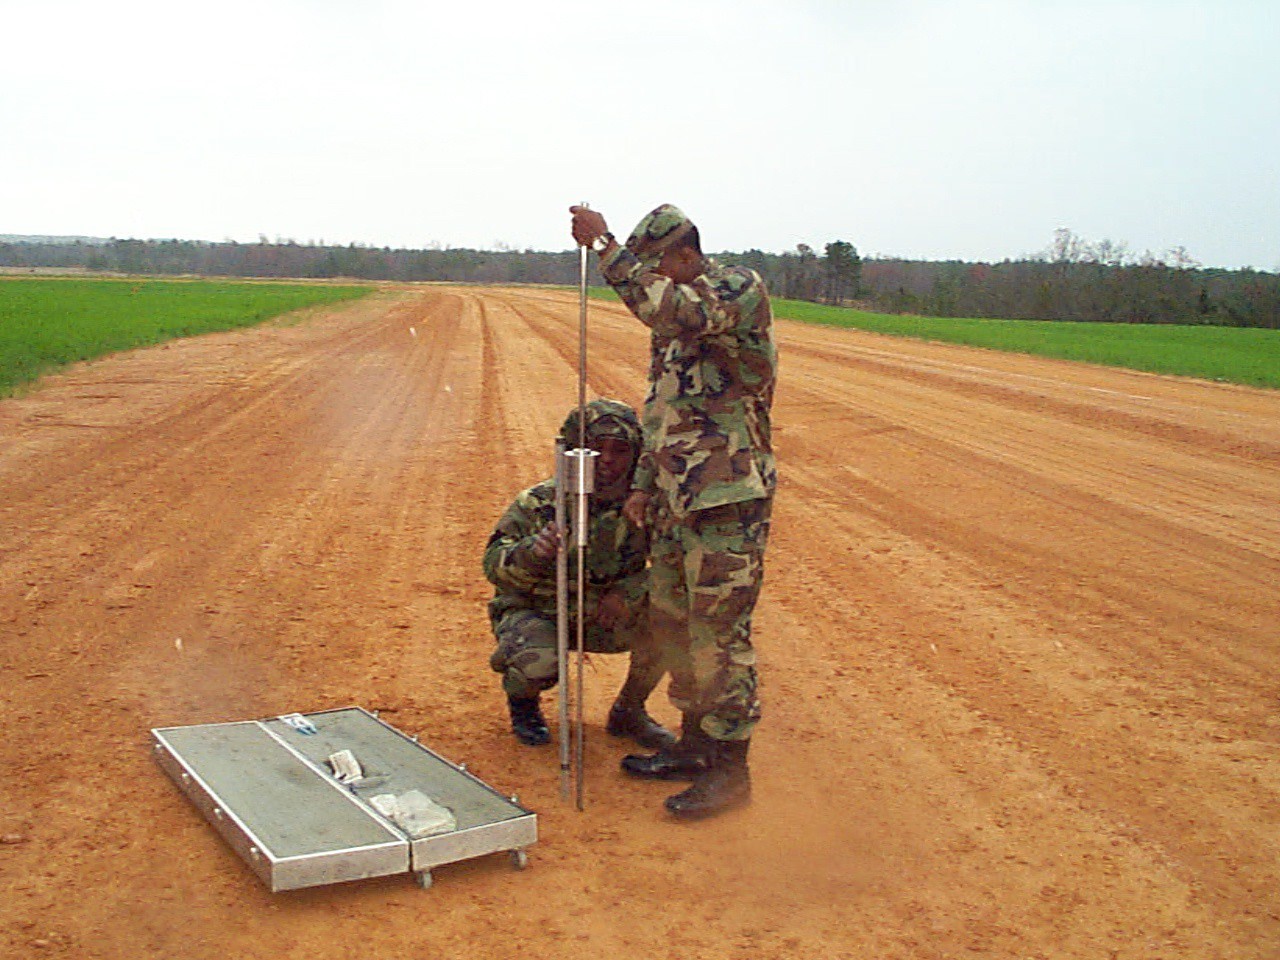
Figure 3
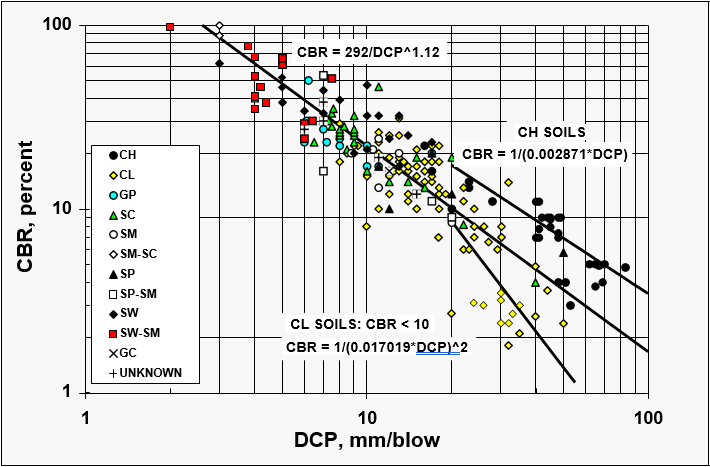
Figure 4
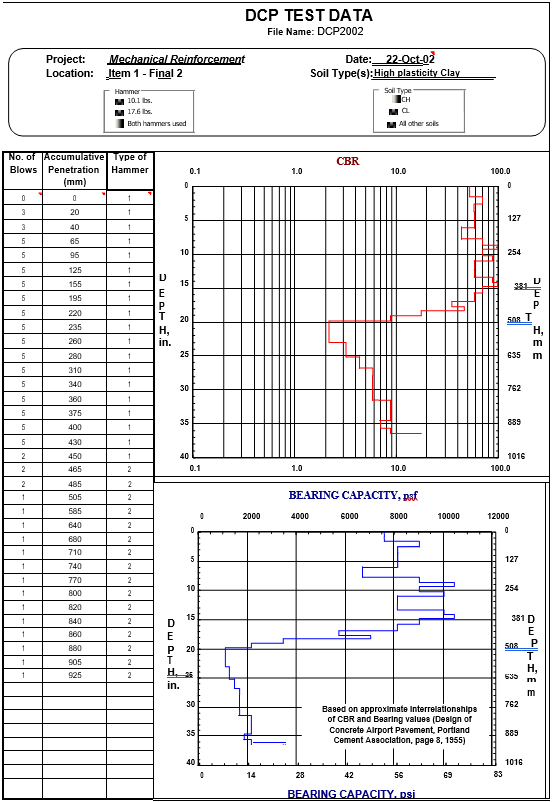
Figure 5
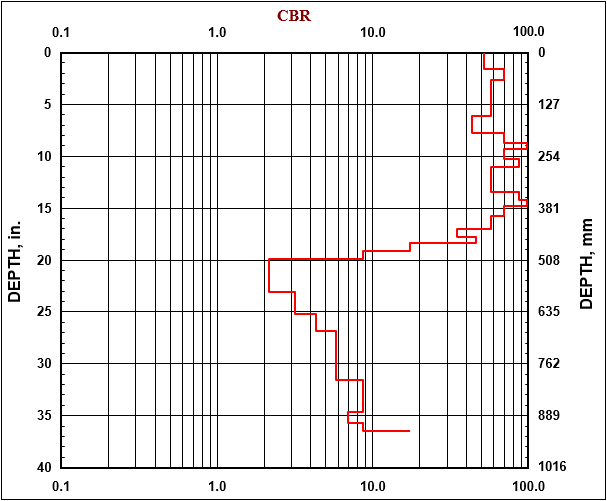
Figure 6
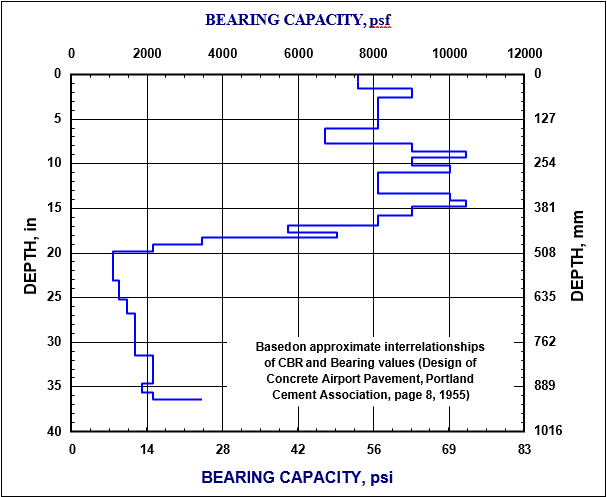
Figure 7
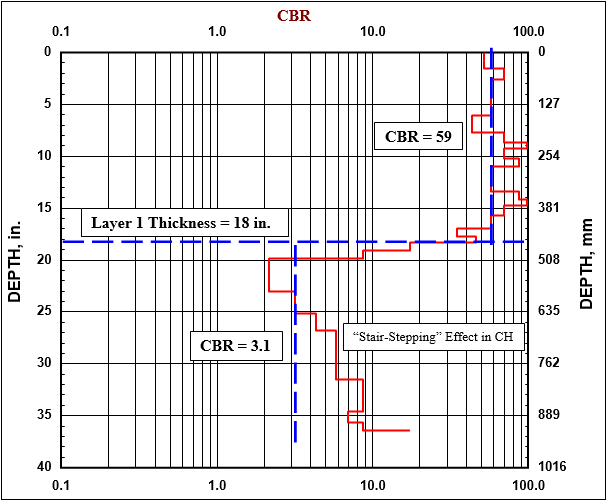
Figure 8
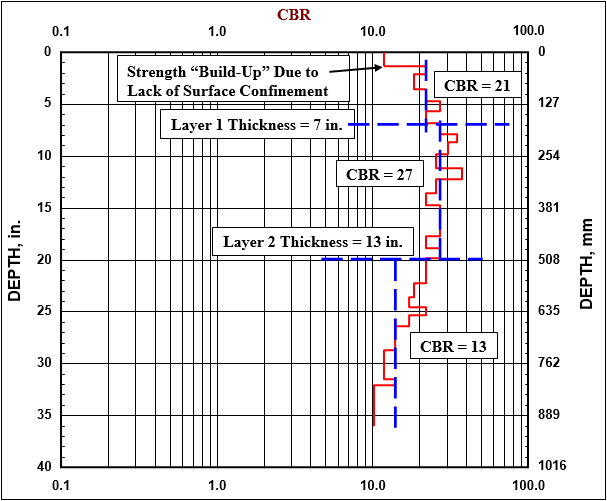
Table 1
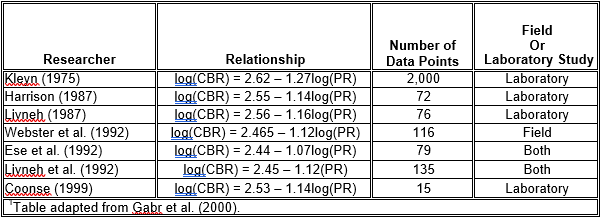
Table 2
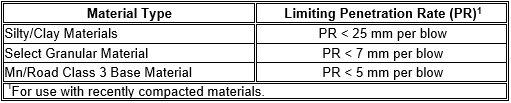
Table 3